Rotational Traction Values on Kentucky Bluegrass
As an athlete accelerates, stops, and changes direction, numerous forces are transmitted to the lower extremities. The interaction between an athlete's shoe and the playing surface has been indicated as a factor in lower extremity injury risk. In particular, high rotational forces may result in increased injuries to the lower extremities due to the foot becoming "entrapped" in the playing surface during pivoting movements (Torg et al., 1974).
The following list contains rotational traction values of various shoes tested on Kentucky bluegrass (Poa pratensis). The Kentucky bluegrass was grown on a sand-based rootzone and was a blend of the following cultivars: Everest (30%), Botique (30%), P105 (30%), and Bewitched (10%). The mowing height was 1.5 inches and the turf coverage was 100%.
2019 Shoes
| Shoe | Traction (Nm) |
|---|---|
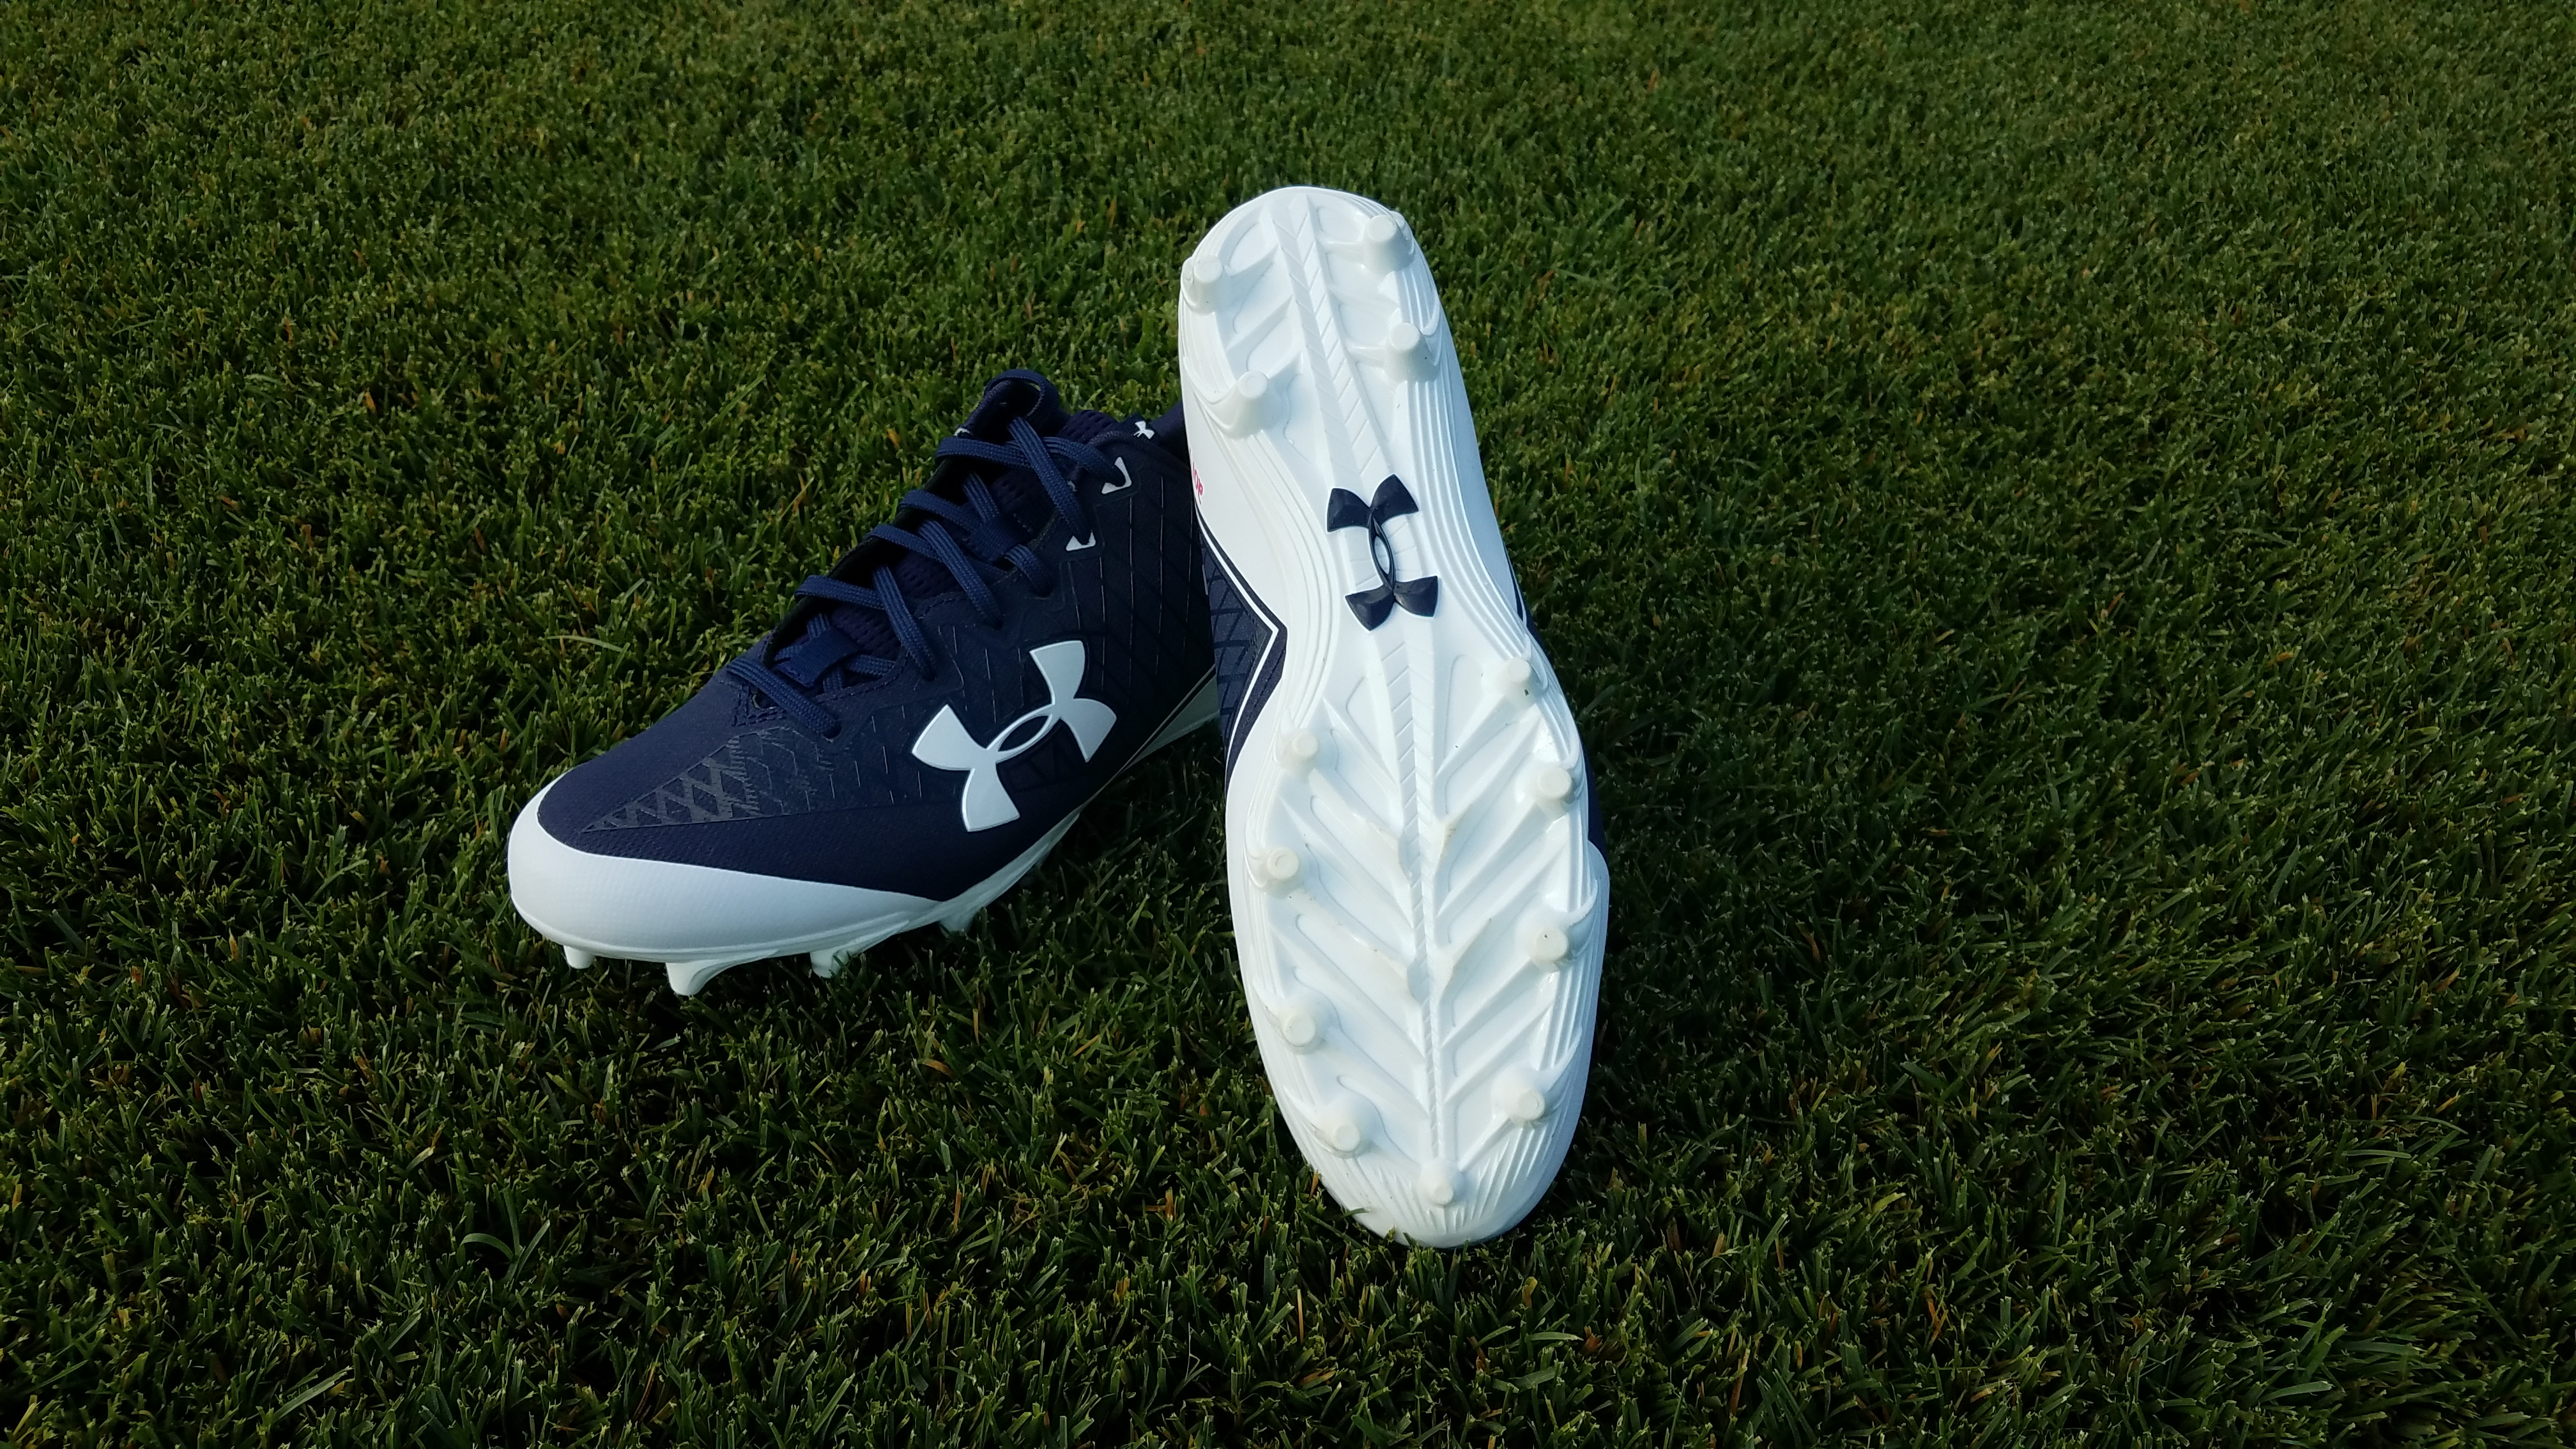
| Under Armour C1N MC | 78.9 |
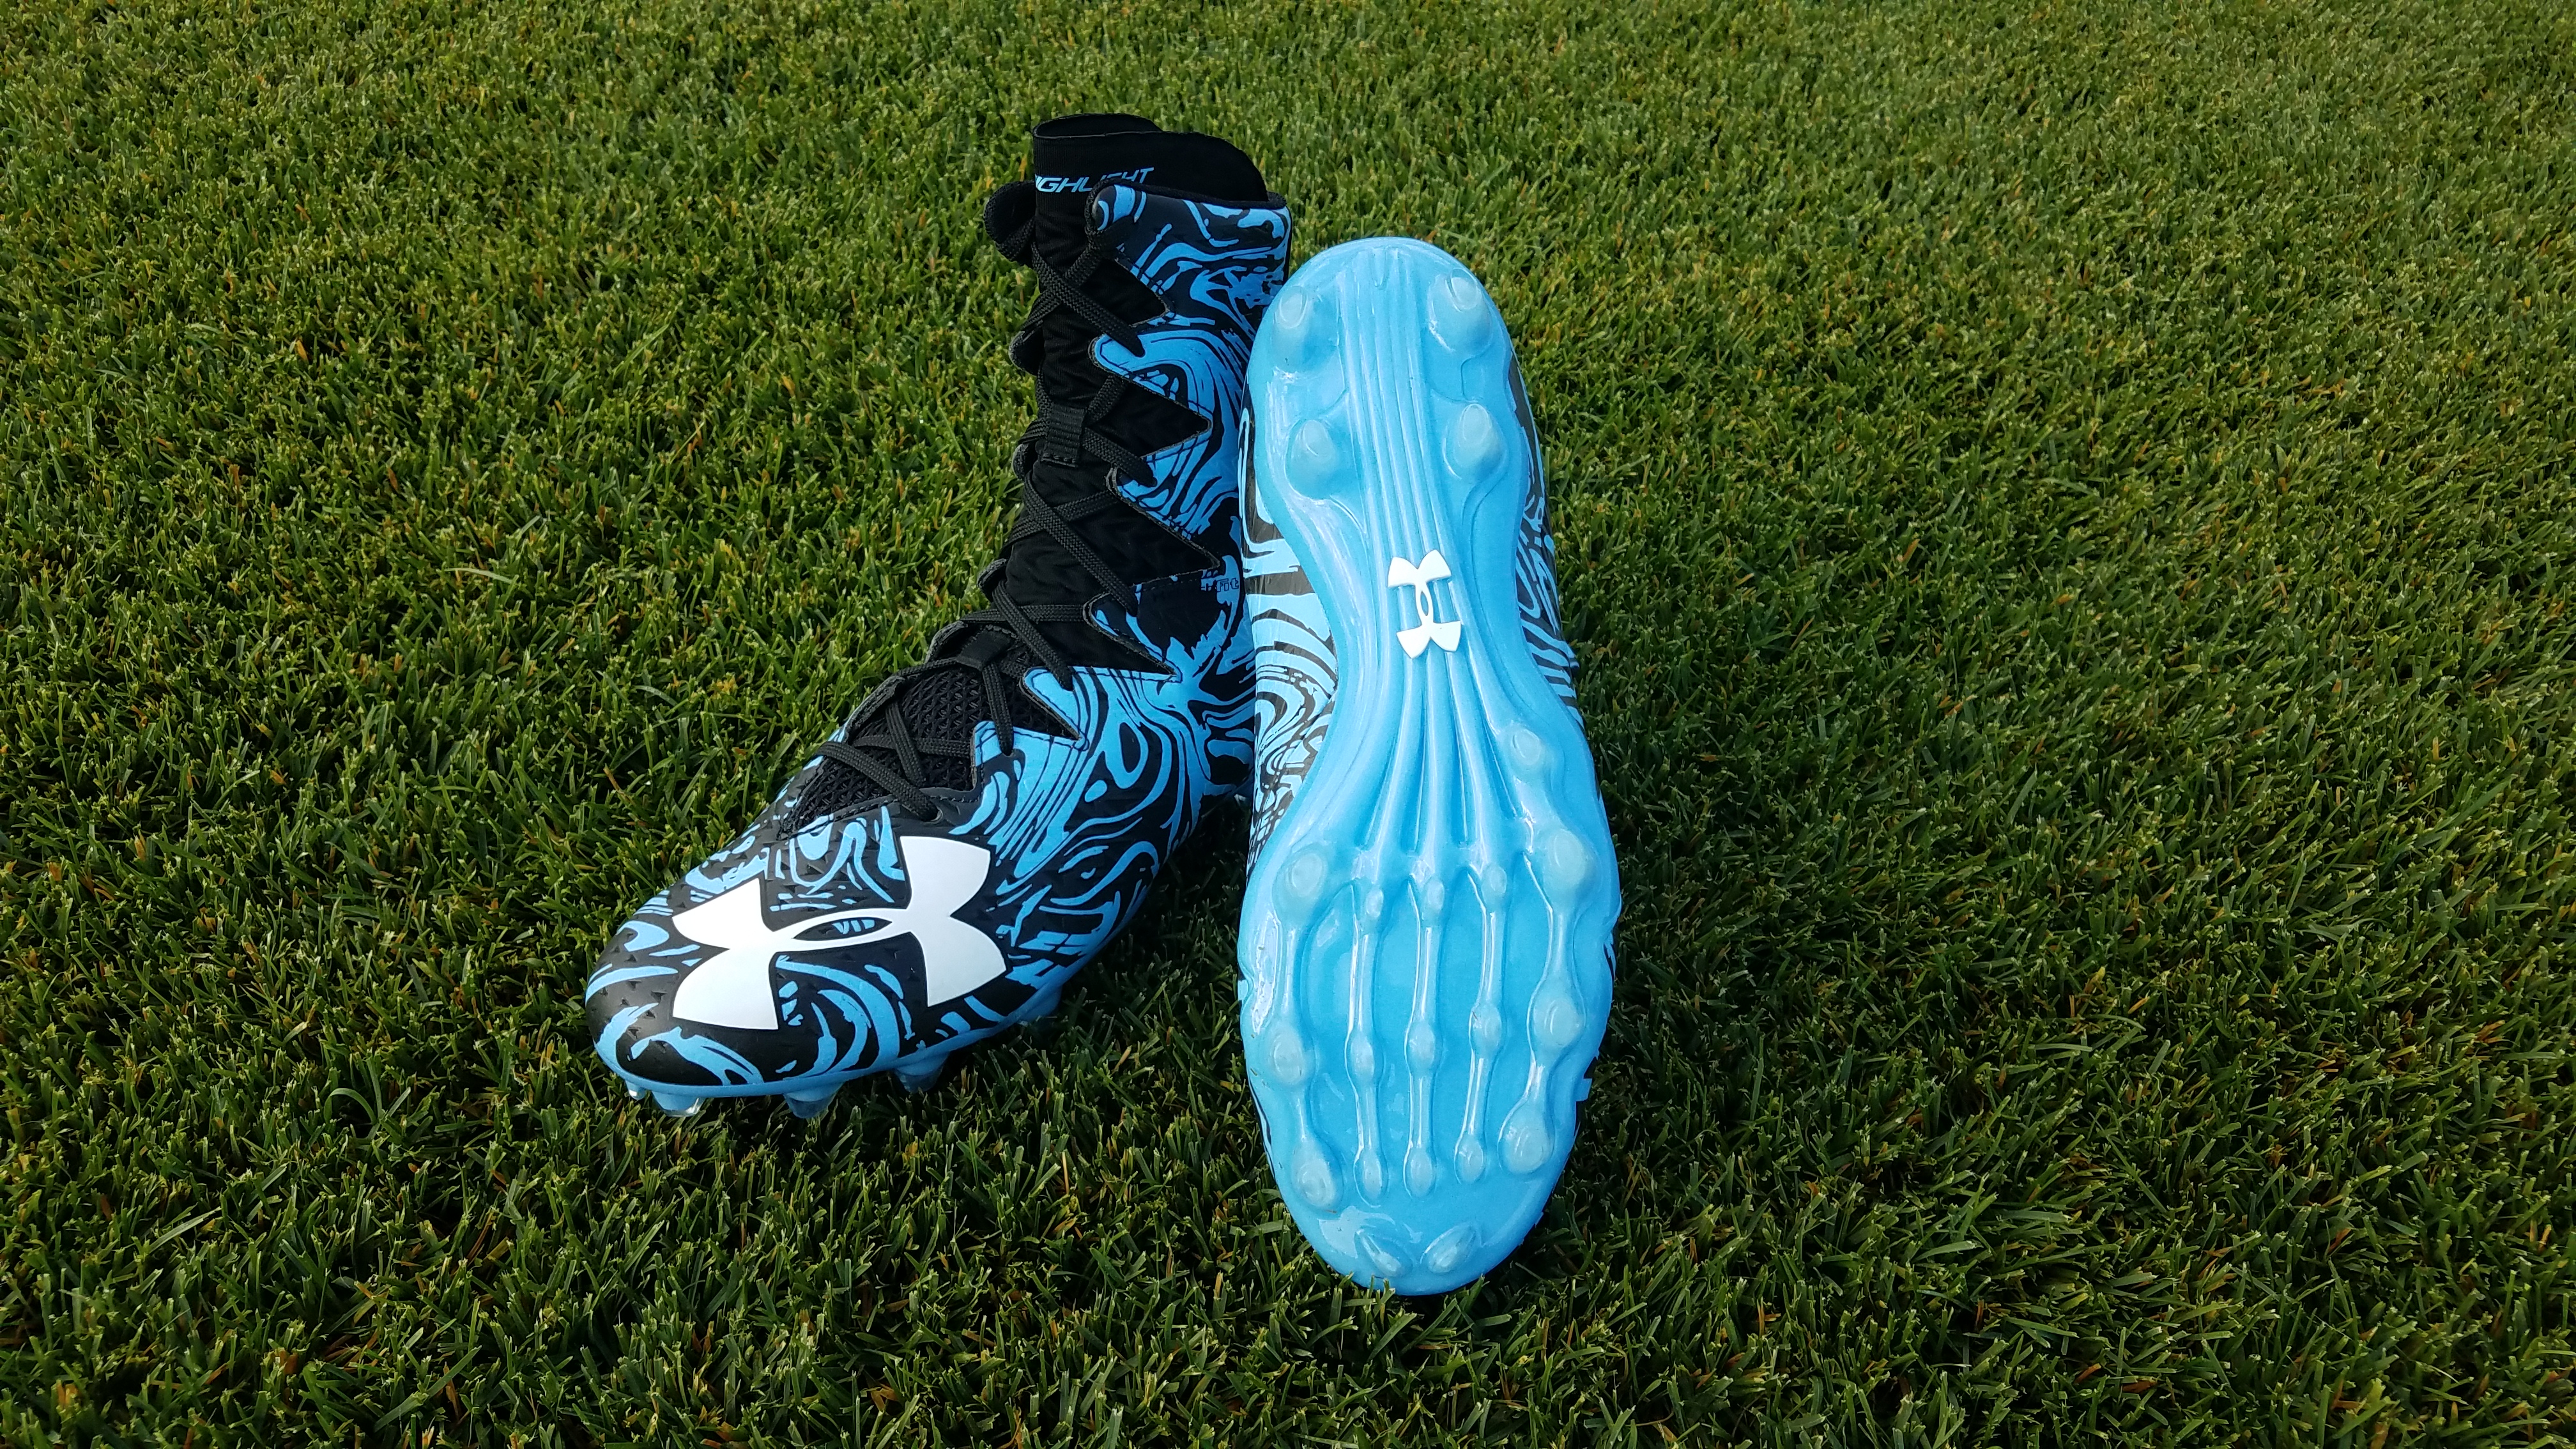
| Under Armour Highlight RM | 78.5 |
| Under Armour Highlight MC | 78.3 |
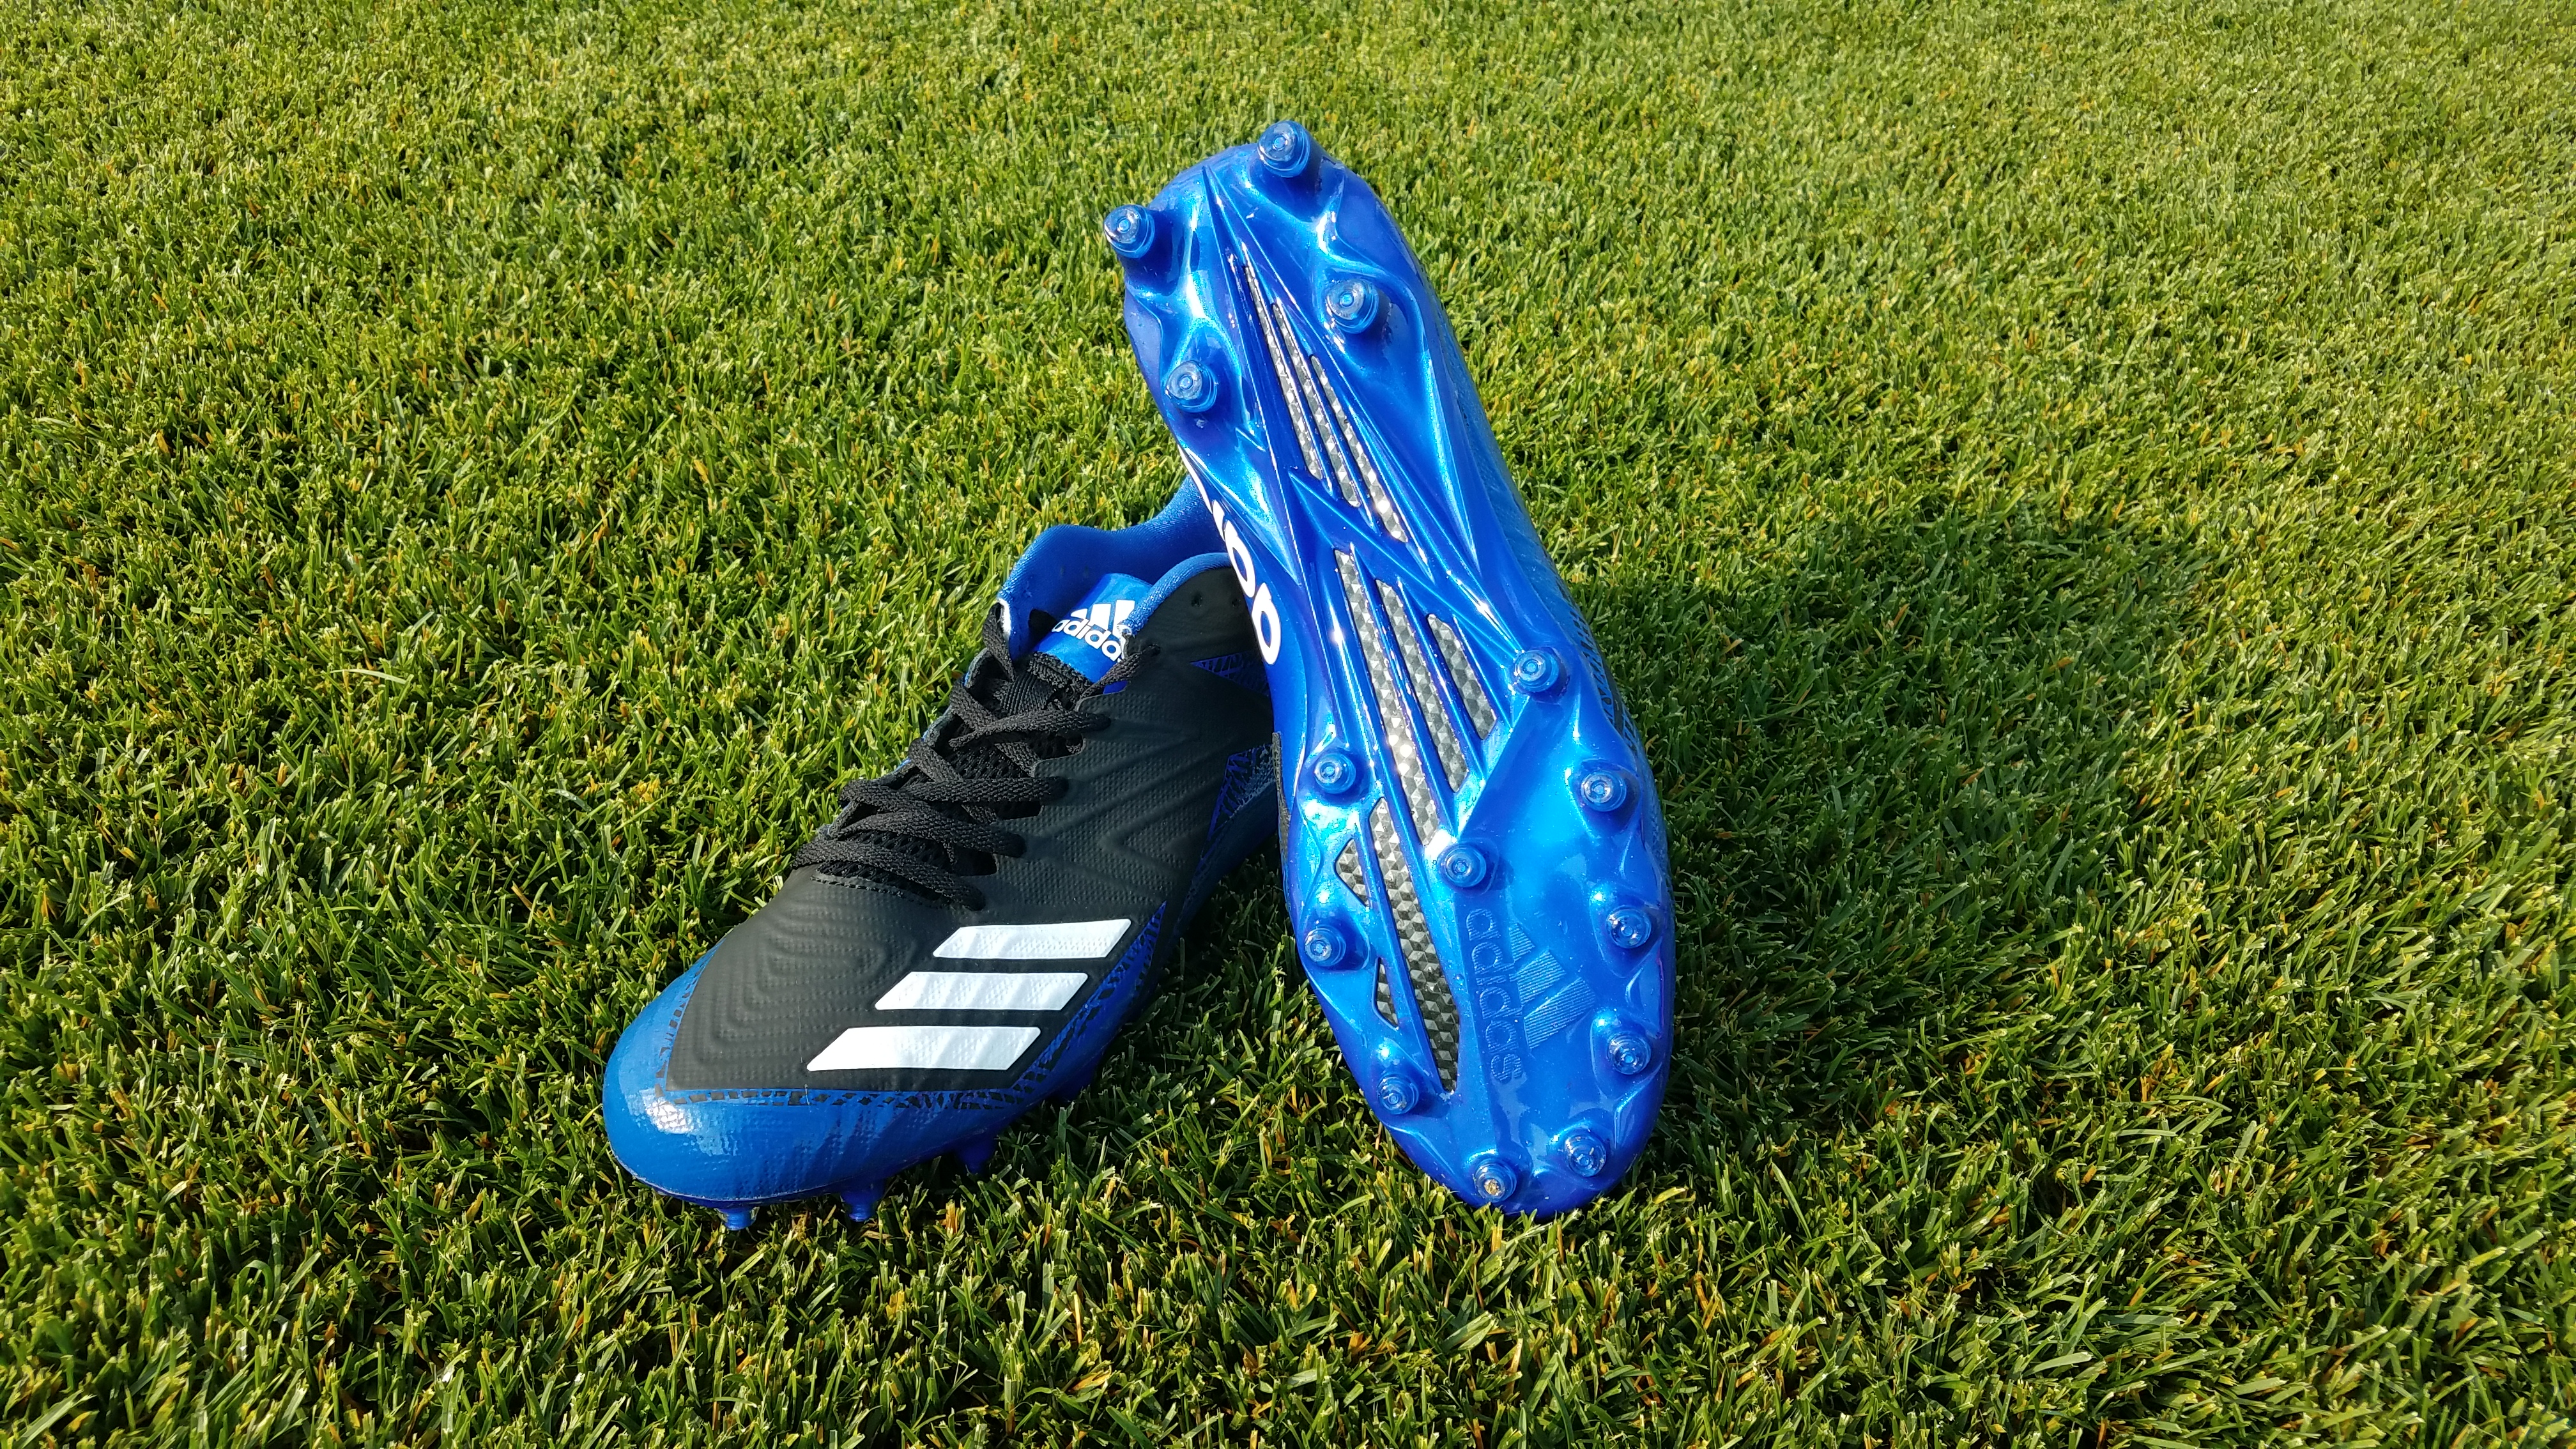
| Adidas Freak Ghost | 78.0 |
| Adidas Freak Carbon Mid | 76.8 |
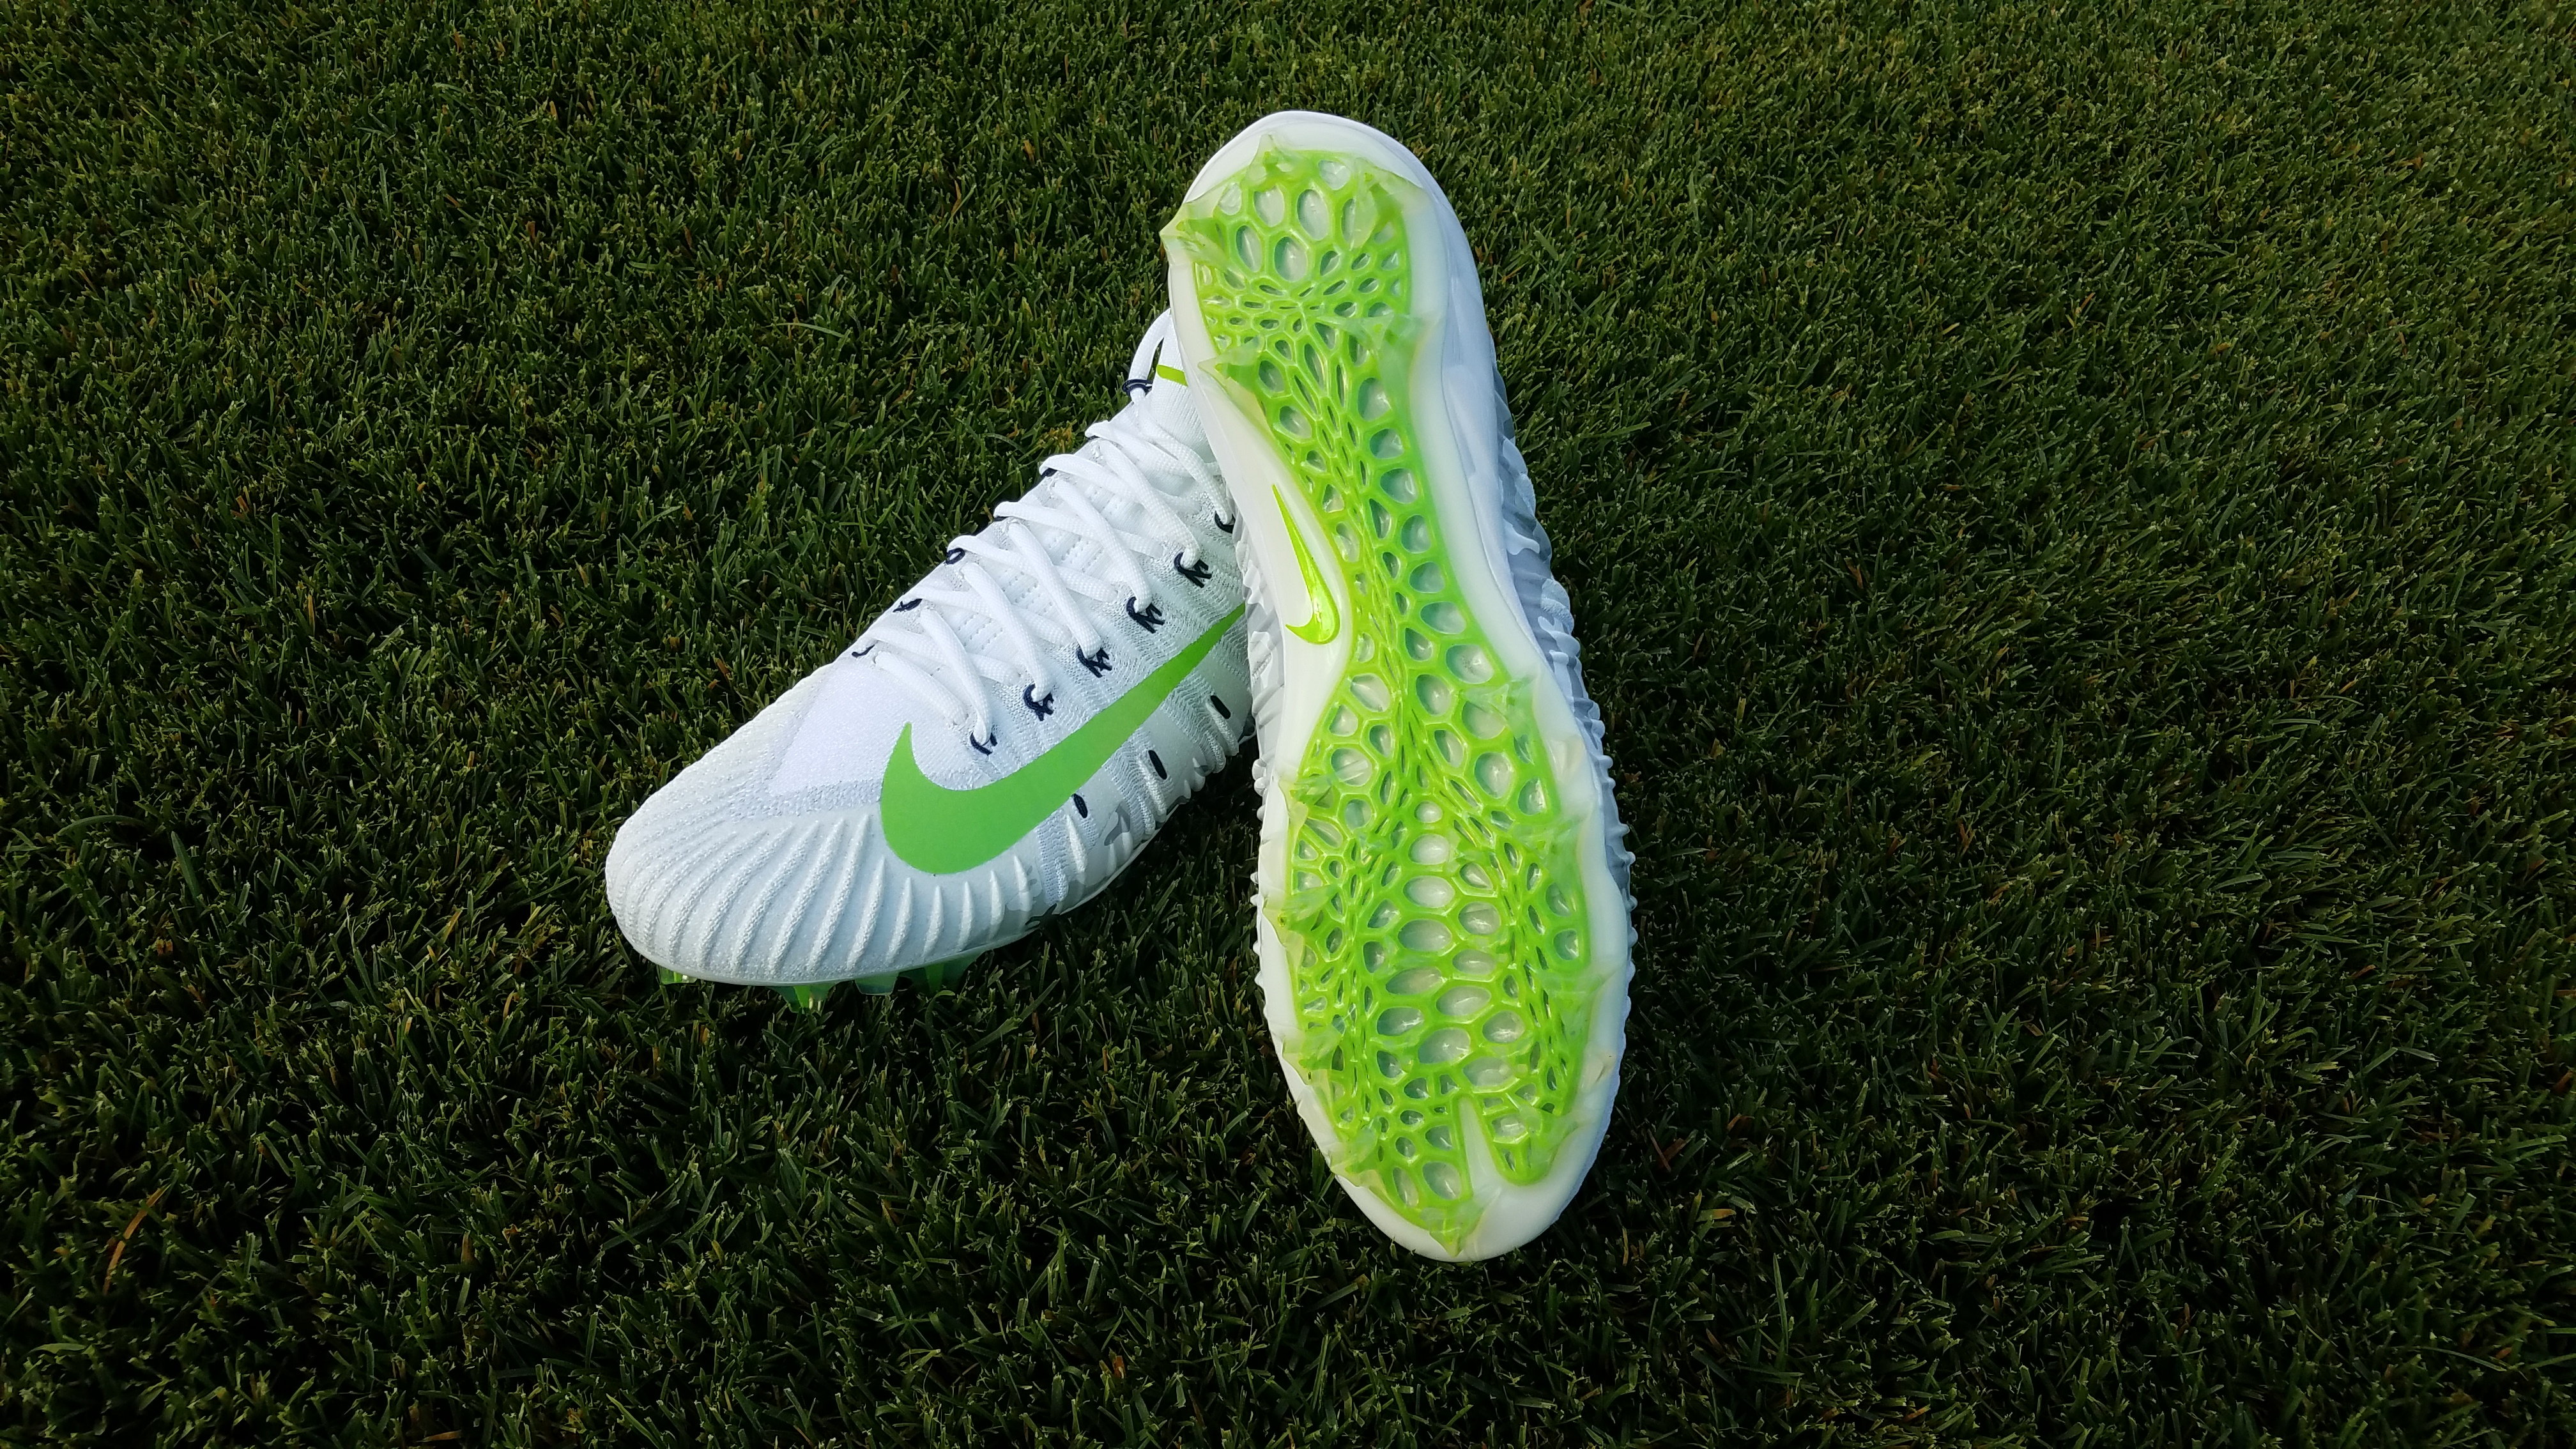
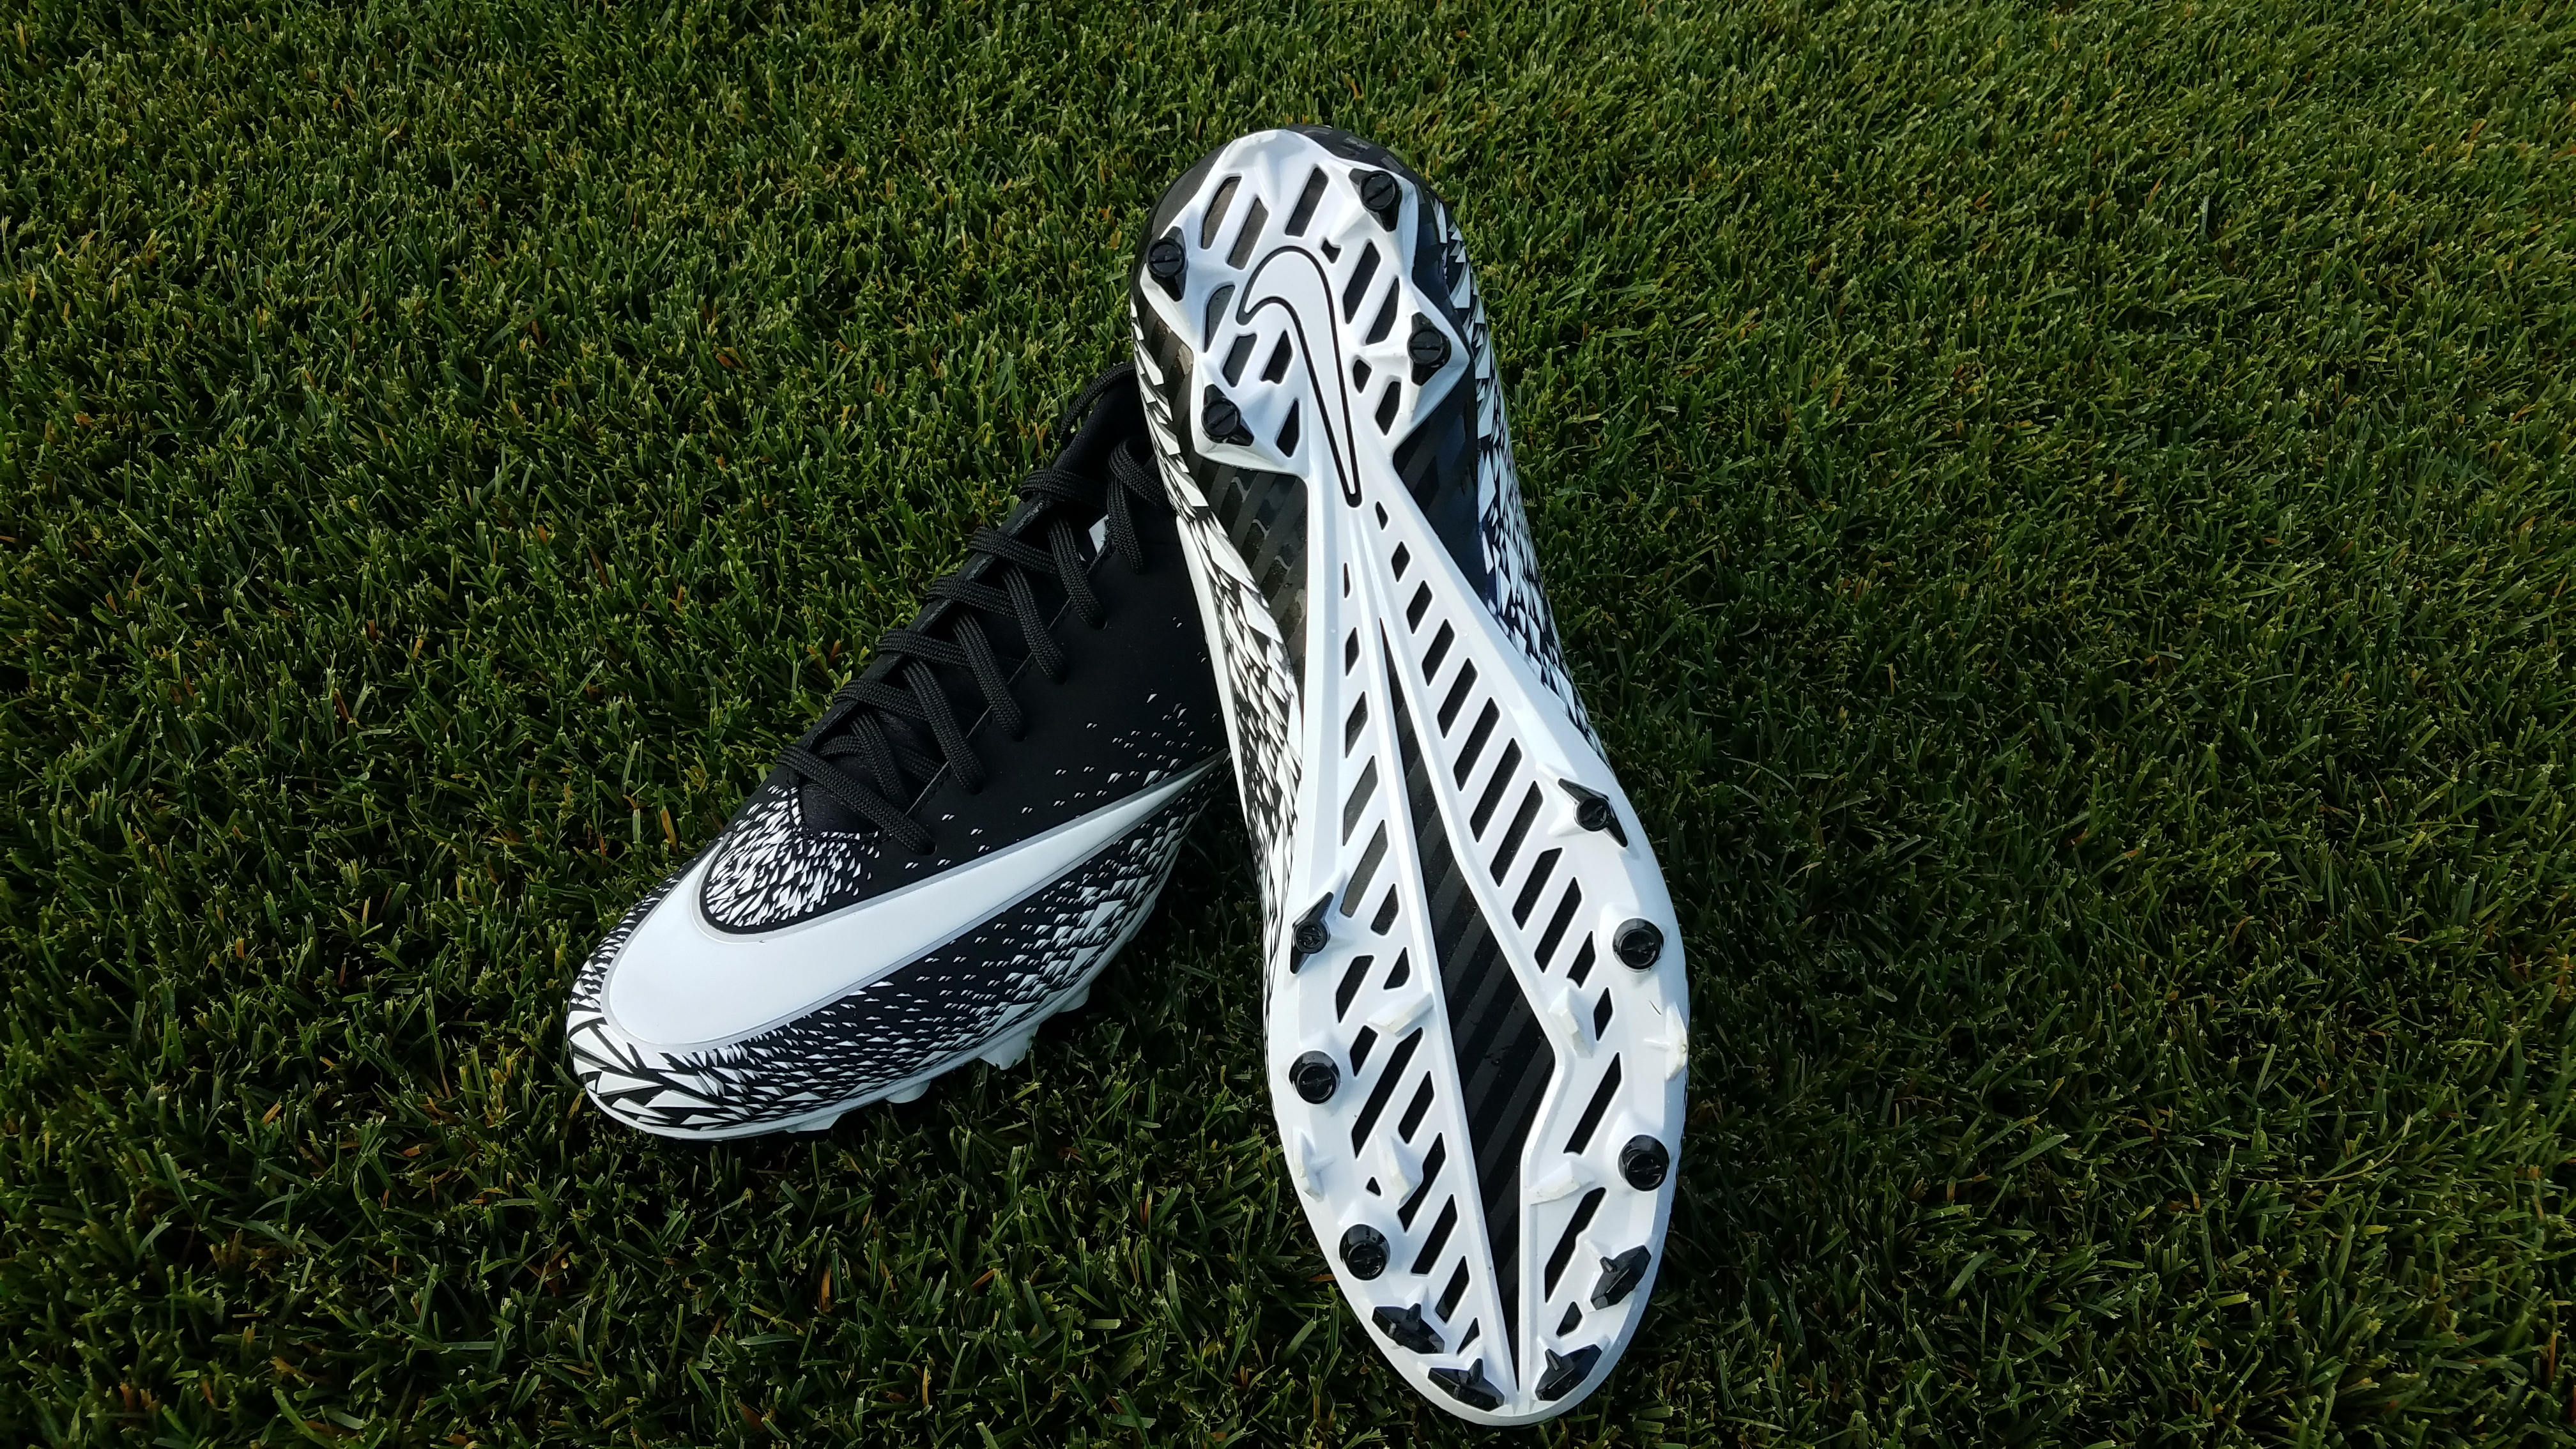
| Nike Alpha Menace Elite 2 | 75.1 |
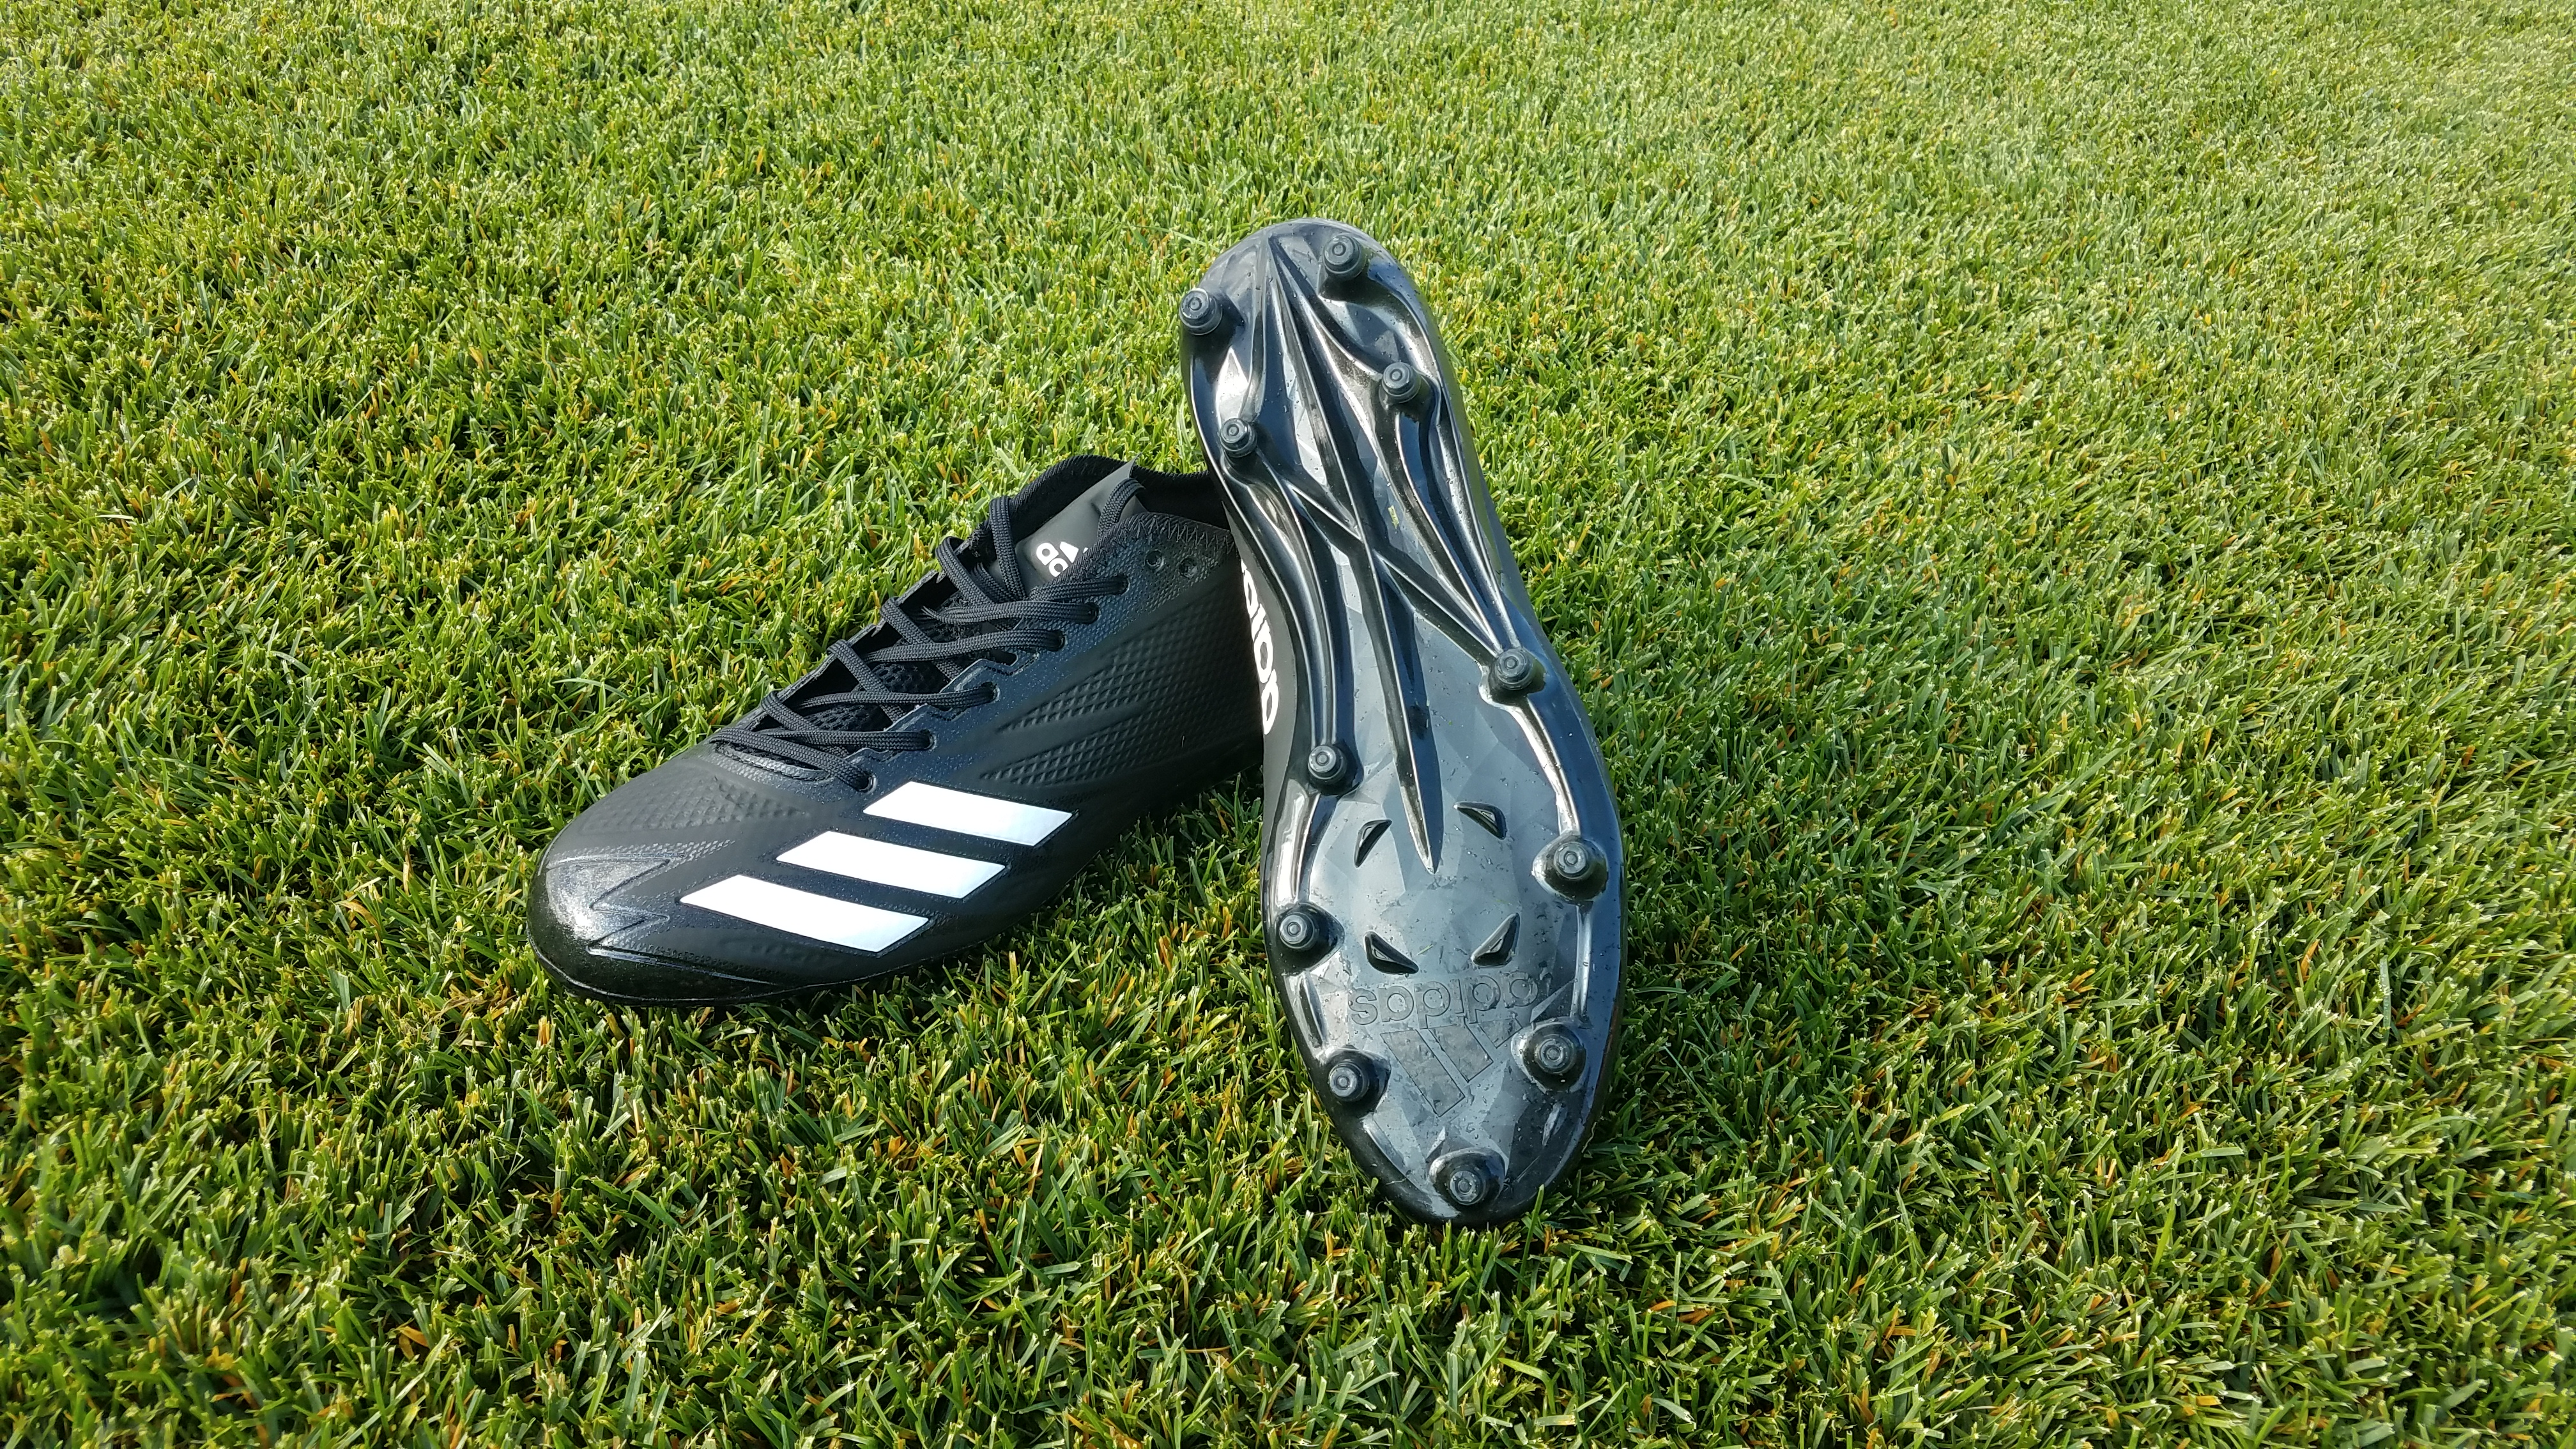
| Adidas adizero 8.0 | 74.6 |
| Under Armour Nitro Low MC | 74.6 |
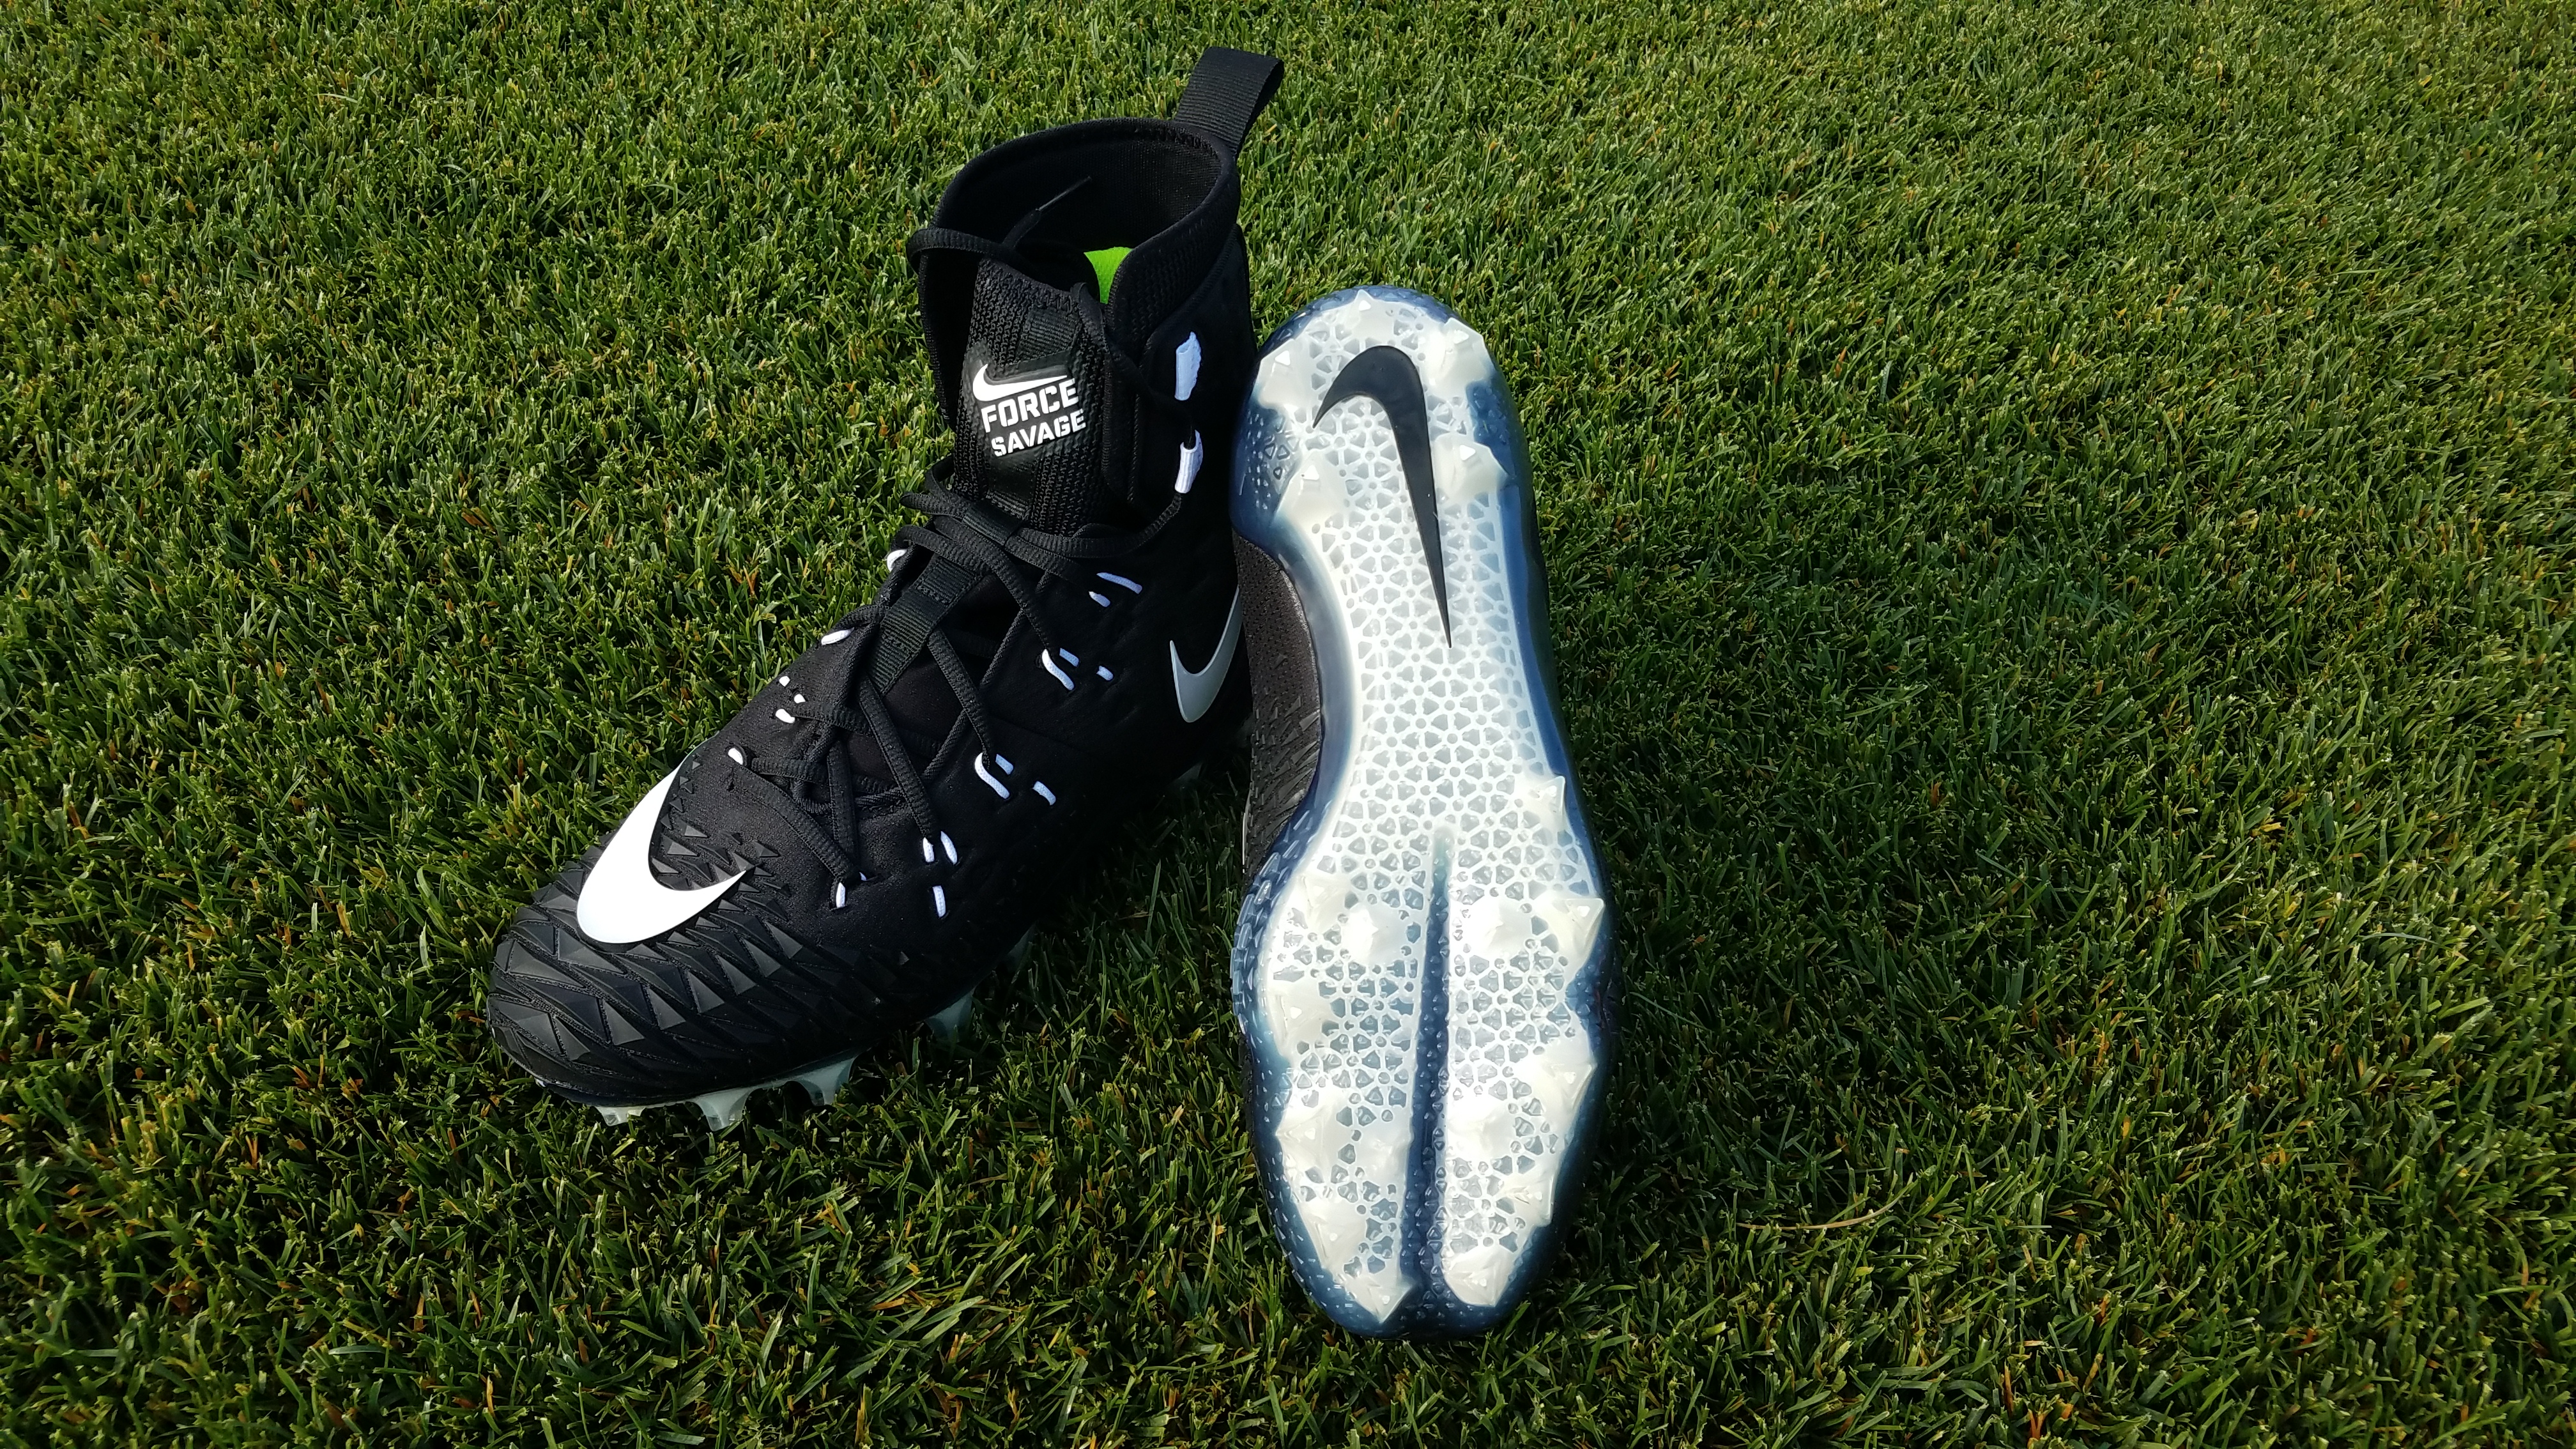
| Nike Force Savage 2 Shark |
72.1 |
| Under Armour Spotlight MC | 71.8 |
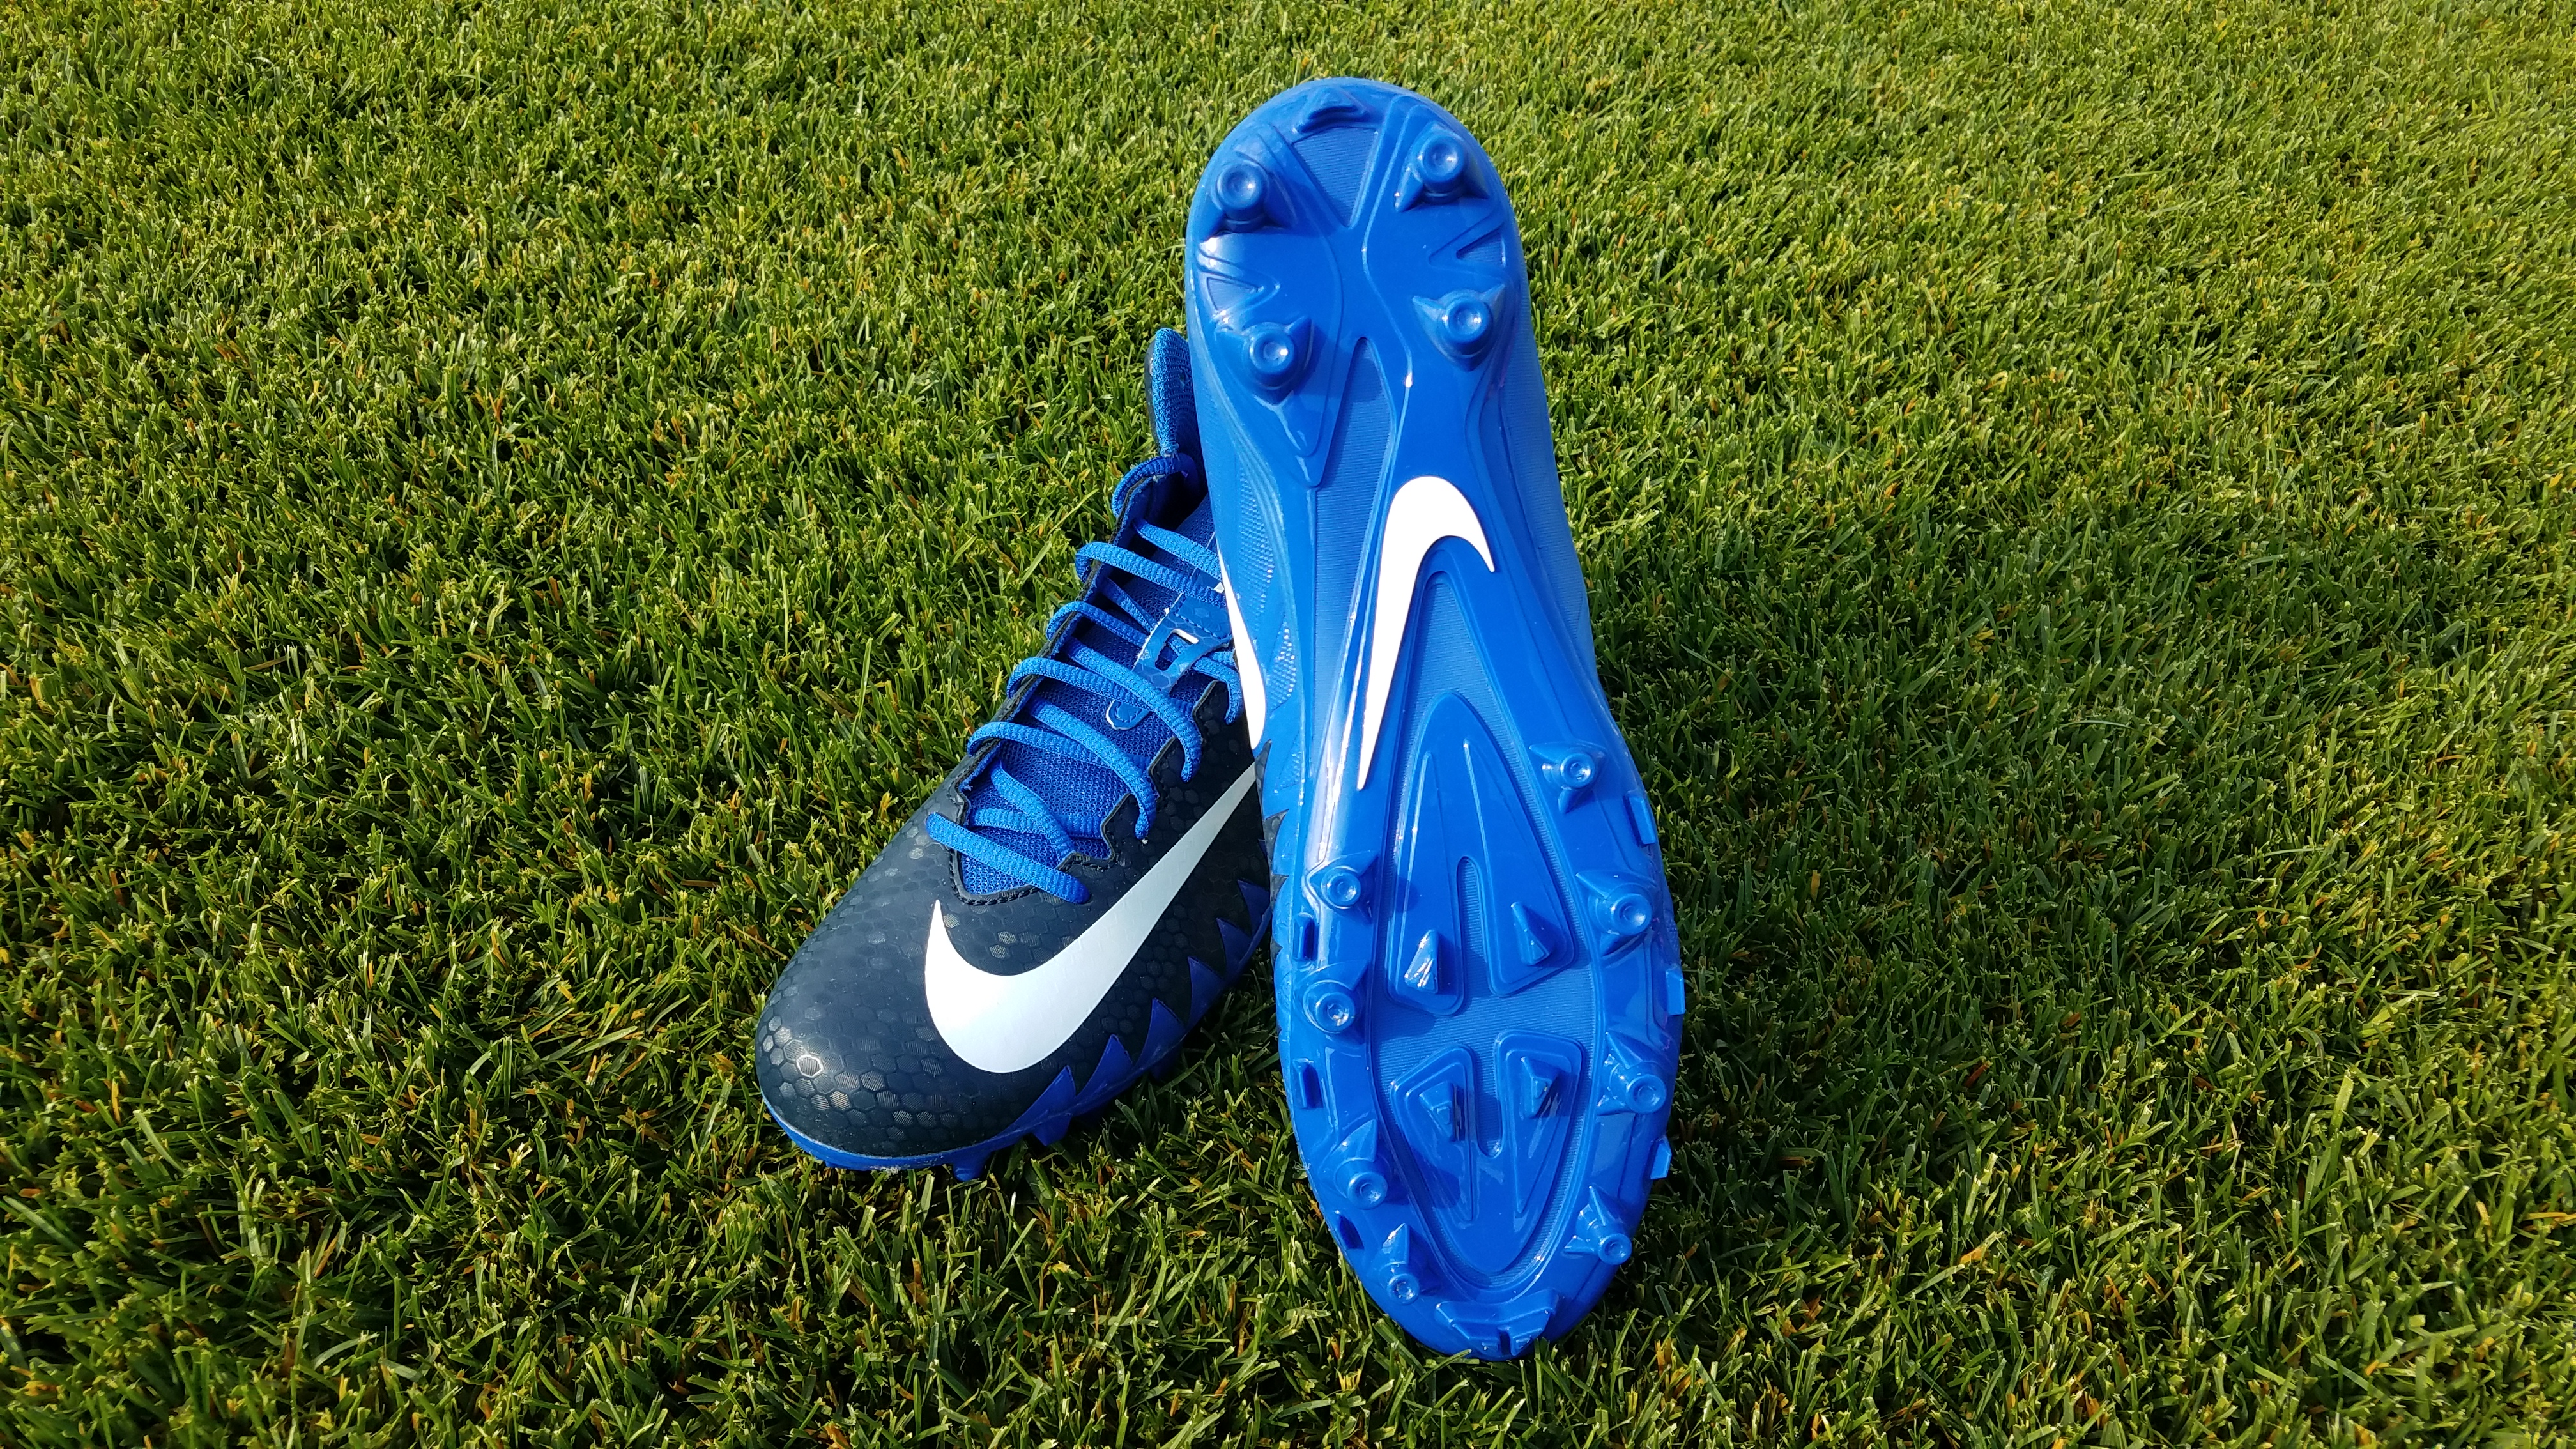
| Nike Vapor Untouchable Pro 3 | 71.8 |
| Nike Vapor Untouchable Varsity 3 TD | 70.6 |
2017 Shoes
| Shoe | Traction (Nm) |
|---|---|
| Nike Force Savage Elite TD | 75.7 |
| Under Armour Highlight Lux RM | 71.6 |
| Nike Alpha Menace Vartisty Mid | 66.7 |
| Nike Alpha Menace Elite | 66.2 |
| Nike Vapor Untouchable Pro | 66.0 |
| Under Armour Highlight Lux MC | 65.5 |
| Nike Vapor Speed 2 TD | 63.9 |
| Adidas Freak x Carbon Low | 63.4 |
| Adidas adiZero 5-Star 6.0 | 61.7 |
| Under Armour Nitro Select Low MC | 61.7 |
| Nike Alpha Sensory Turf | 58.9 |
Previously Tested Shoes
The colors in the table below represent each shoe's traction value relative to the other shoes tested on Kentucky bluegrass, with red being the highest and green being the lowest.
*HSD: Tukey Honestly Significant Difference Test. Traction means within the value listed are not statistically different from one another.
Interpretation of Results
Rotational traction measured with mechanical devices such as Pennfoot allow for comparisons among shoe-types and playing surfaces; however, 'safe' and 'unsafe' traction levels have not been established in the scientific community, as this type of data has not been directly correlated with injury risk. Although researchers have yet to establish 'safe' threshold levels, it is generally accepted that low levels of rotational traction are desired over high levels from a lower extremity injury risk standpoint (Lambson et al., 1996). However, if traction is too low, playability may be reduced as athletes may be prone to slipping, thus increasing potential for other types of injuries.
Rotational traction values are presented in Newton-meters (Nm), which is the standard rotational traction unit (ASTM, 2009).
Traction data (four measurements per each shoe-surface combination) were analyzed for each playing surface using Analysis of Variance (ANOVA). Tukey's Honestly Significant Differences (HSD) test was used for means separation at the alpha = 0.05 level. It is important to note that traction values within the HSD value listed are not statistically different from one another.
Disclaimer: The traction values reported in this database represent the traction of each shoe under the conditions on the day of testing. Variations in traction values due to surface wetness, turf coverage, mowing height, soil type, soil moisture, soil compaction, soil temperature, air temperature, and other environmental conditions are possible. Additionally, athlete age, athlete weight, athlete skill level, and other attributes affect traction. Rotational traction values have not been directly correlated to injury risk.
