Links to Traction Databases
Traction on Kentucky Bluegrass
This database contains rotational traction values generated by various shoes on common playing surfaces.
As an athlete accelerates, stops, and changes direction, numerous forces are transmitted to the lower extremities. The interaction between an athlete's shoe and the playing surface has been indicated as a factor in lower extremity injury risk. In particular, high rotational forces may result in increased injuries to the lower extremities due to the foot becoming "entrapped" in the playing surface during pivoting movements (Torg et al., 1974).
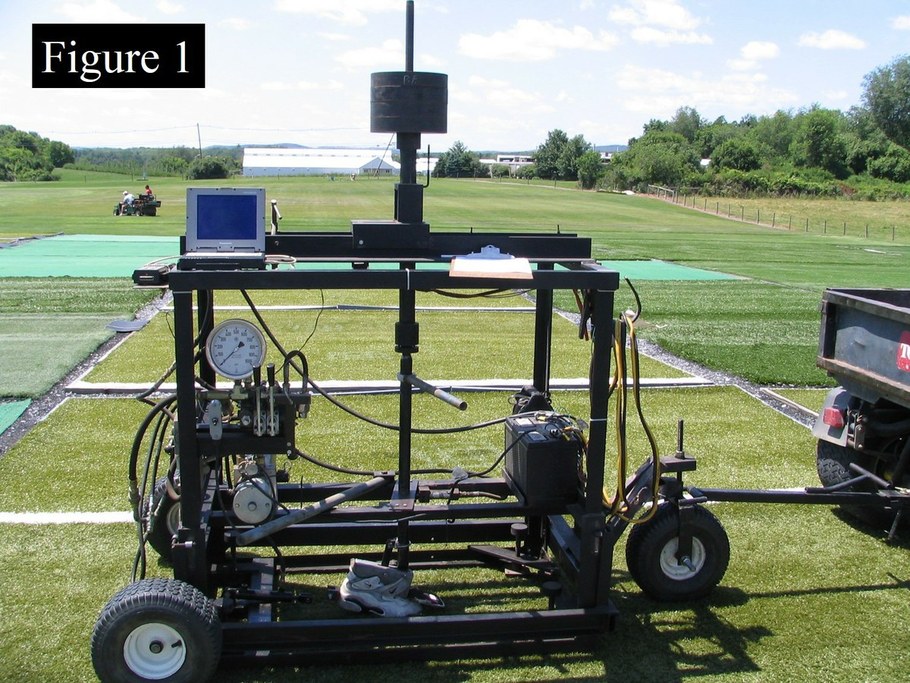
The rotational traction data reported in this database was collected using Pennfoot (McNitt et al., 1997; Fig 1), which closely matches ASTM F2333-04 - Standard Test Method for Traction Characteristics of the Athletic Shoe- Sports Surface Interface (ASTM, 2009). The normal force (loading weight) used was 237 lbs. (1054 N). Measurements were taken during sunny conditions on research plots with 100% turfgrass coverage.
For additional information on traction along with data collected on various synthetic turf systems, please click here.

Interpretation of Results
Rotational traction measured with mechanical devices such as Pennfoot allow for comparisons among shoe-types and playing surfaces; however, 'safe' and 'unsafe' traction levels have not been established in the scientific community, as this type of data has not been directly correlated with injury risk. Although researchers have yet to establish 'safe' threshold levels, it is generally accepted that low levels of rotational traction are desired over high levels from a lower extremity injury risk standpoint (Lambson et al., 1996). However, if traction is too low, playability may be reduced as athletes may be prone to slipping, thus increasing potential for other types of injuries.
Rotational traction values are presented in Newton-meters (Nm), which is the standard rotational traction unit (ASTM, 2009).
Traction data (four measurements per each shoe-surface combination) were analyzed for each playing surface using Analysis of Variance (ANOVA). Tukey's Honestly Significant Differences (HSD) test was used for means separation at the alpha = 0.05 level. It is important to note that traction values within the HSD value listed are not statistically different from one another.
For each playing surface, rotational traction values for all shoes are presented in a table that is color-coded. The colors represent each shoe's traction value relative to the other shoes tested on that particular playing surface, with red being the highest and green being the lowest.
References
American Society for Testing and Materials [ASTM]. 2009. Annual Book of ASTM Standards. Vol. 15.07 End Use Products. Standard test method for traction characteristics of the athletic shoe-sports surface interface. F-2333-04. ASTM, West Conshohocken, PA.
Lambson, R.B., B.S. Barnhill, and R.W. Higgins. 1996. Football cleat design and its effect on anterior cruciate ligament injuries. A three-year prospective study. Am. J. Sports Med. 24(2):155-159.
McNitt, A.S., R.O. Middour, and D.V. Waddington. 1997. Development and evaluation of a method to measure traction on turfgrass surfaces. J. Test. Eval. 25(1):99-107.
Torg, J.S., T.C. Quedenfeld, and S. Landau. 1974. The shoe-surface interface and its relationship to football knee injuries. J. Sports Med. 2(5):261-269.
Disclaimer: The traction values reported in this database represent the traction of each shoe under the conditions on the day of testing. Variations in traction values due to infill depth (synthetic turf), infill composition (synthetic turf), fiber type (synthetic turf), surface wetness, turf coverage, mowing height, soil type, soil moisture, soil compaction, soil temperature, air temperature, and other environmental conditions are possible. Additionally, athlete age, athlete weight, athlete skill level, and other attributes affect traction. Rotational traction values have not been directly correlated to injury risk.

