Analyzing Root Sample
WinRhizo will prompt the user to open or create a file for analysis results to be saved to. This is a text file that can easily be opened in standard spreadsheet programs.
To analyze the image, the user selects the region(s) of interest, and it is analyzed. When scanned images are analyzed, the software uses thresholding to determine what is root and what is not root (each pixel is classified as either root or not root based on its grayscale value; this is why shadows in images are problematic). Portions of the image can be excluded from analysis if necessary, and there are basic editing tools if minor image editing is required.
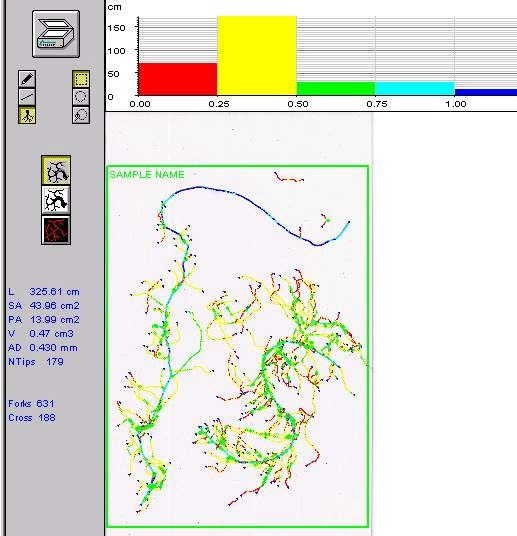
In this screen image, the color traces on top of the image show roots classified by diameter. The color histogram shows length by diameter class
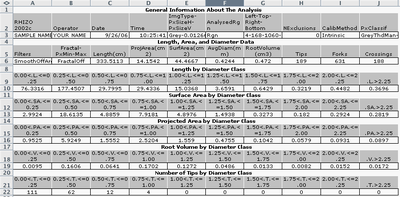
Below is from an Excel file corresponding to the above image. Several columns were deleted, and the output was "stacked" to allow it to fit the screen.


